What are InfoGraphics?
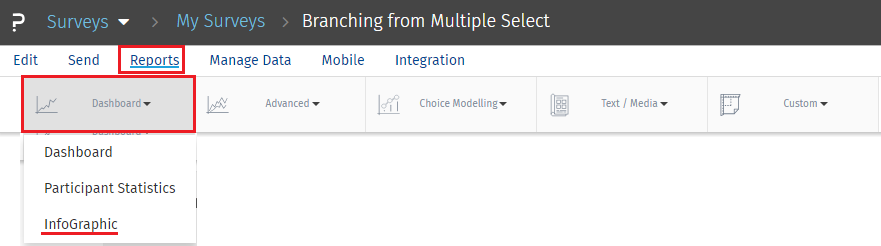
QuestionPro InfoGraphics or Information graphics are graphic visual representations of your survey data. These graphics present complex information quickly and clearly. For InfoGraphics go to:
- Login » Surveys » Reports » Dashboard » InfoGraphic
You can share the InfoGraphic via the InfoGraphic Link. You can also embed it on your website, blog, or share on Facebook, Twitter, or LinkedIn. You can also create a QR code that will allow mobile users to snap the QR code with their mobile devices and directly access the infographic.
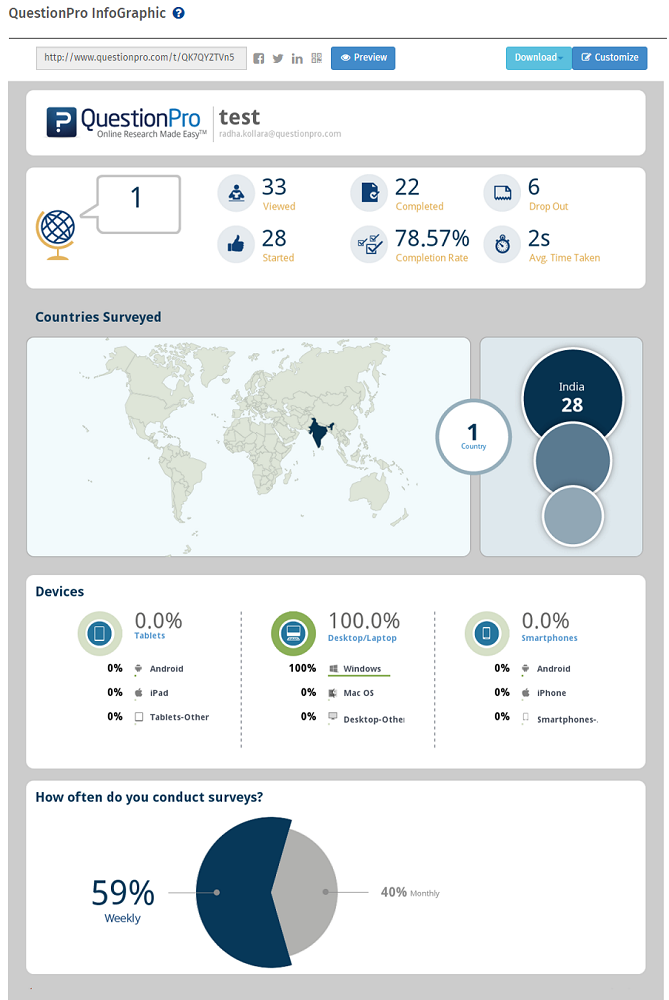
The Infographic includes:
- Overall Participant Statistics
- Distribution segmented by countries
- Response Chart - Daily or Weekly or Monthly
- Data for multiple select type questions
Example:

Open-ended text responses are not included in the InfoGraphic.
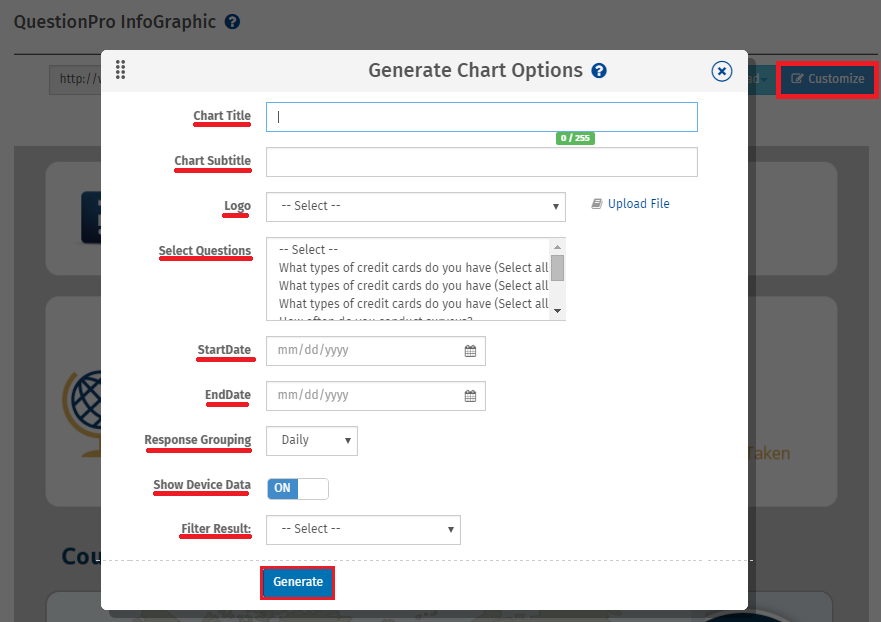
How can I customize the infographic?
Clicking on the Customize button will open the popup where you can customize:
- Title
- Subtitle
- Logo - You can upload your logo. The logo should be 280 px X 50 px. If either width or height exceeds, the logo will be resized to fit.
- Question Display - Select questions that you want to display on the InfoGraphic
- Response Chart Start Date
- Response Grouping - Daily, Weekly or Monthly
- Show Device Data - Decide whether or not you want to show the device data which displays how respondents accessed your survey.
- Show demographics - If you included demographic questions from the KnowledgeBank, they can be added to the Infographic.
 Survey Software
Easy to use and accessible for everyone. Design, send and analyze online surveys.
Survey Software
Easy to use and accessible for everyone. Design, send and analyze online surveys.
 Research Suite
A suite of enterprise-grade research tools for market research professionals.
Research Suite
A suite of enterprise-grade research tools for market research professionals.
 Customer Experience
Experiences change the world. Deliver the best with our CX management software.
Customer Experience
Experiences change the world. Deliver the best with our CX management software.
 Employee Experience
Create the best employee experience and act on real-time data from end to end.
Employee Experience
Create the best employee experience and act on real-time data from end to end.